
My earlier post ‘Plotting Local Coronavirus Cases’ shows one way of plotting graphs of coronavirus cases.
The latest graphs I’ve made are below.
BTW, the Scottish Parliament Information Centre now publish various good charts. They say to use Google Chrome but the charts seem to work fine in Apple Safari. YMMV.
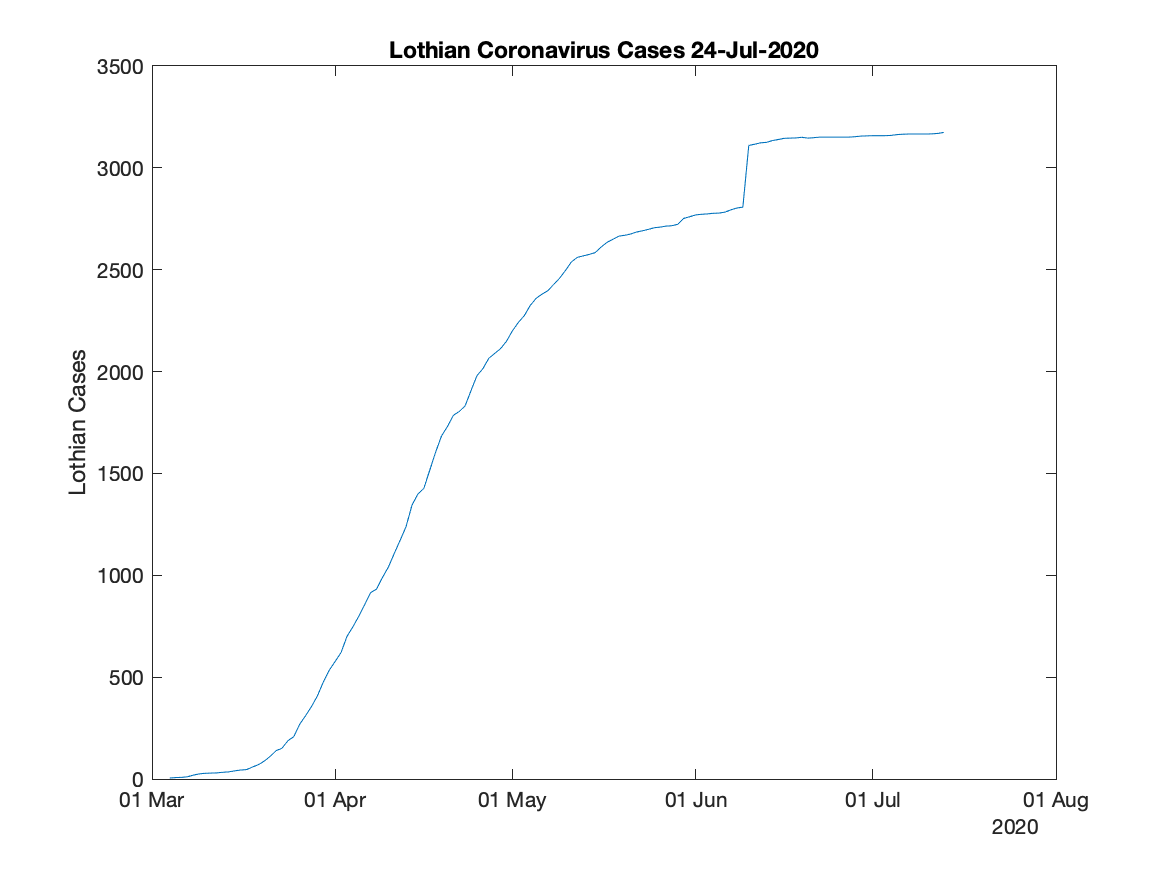
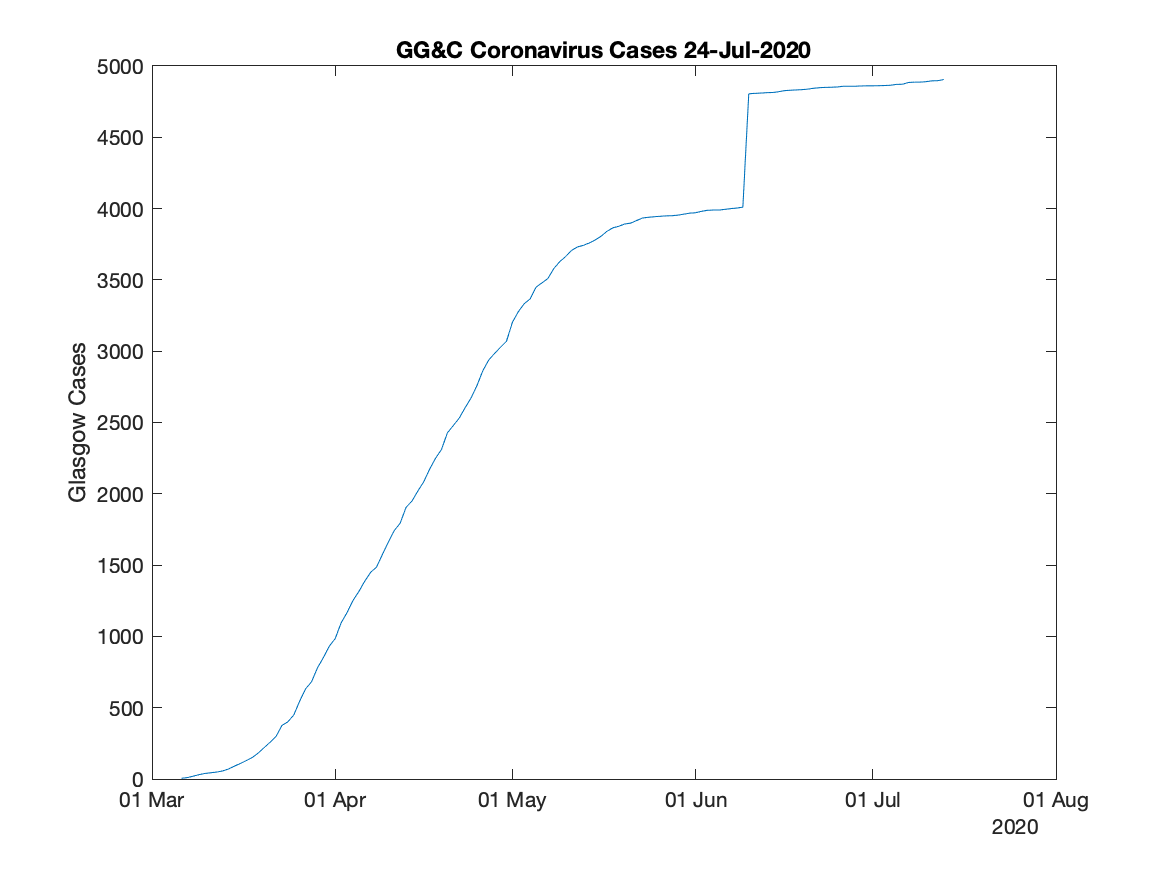
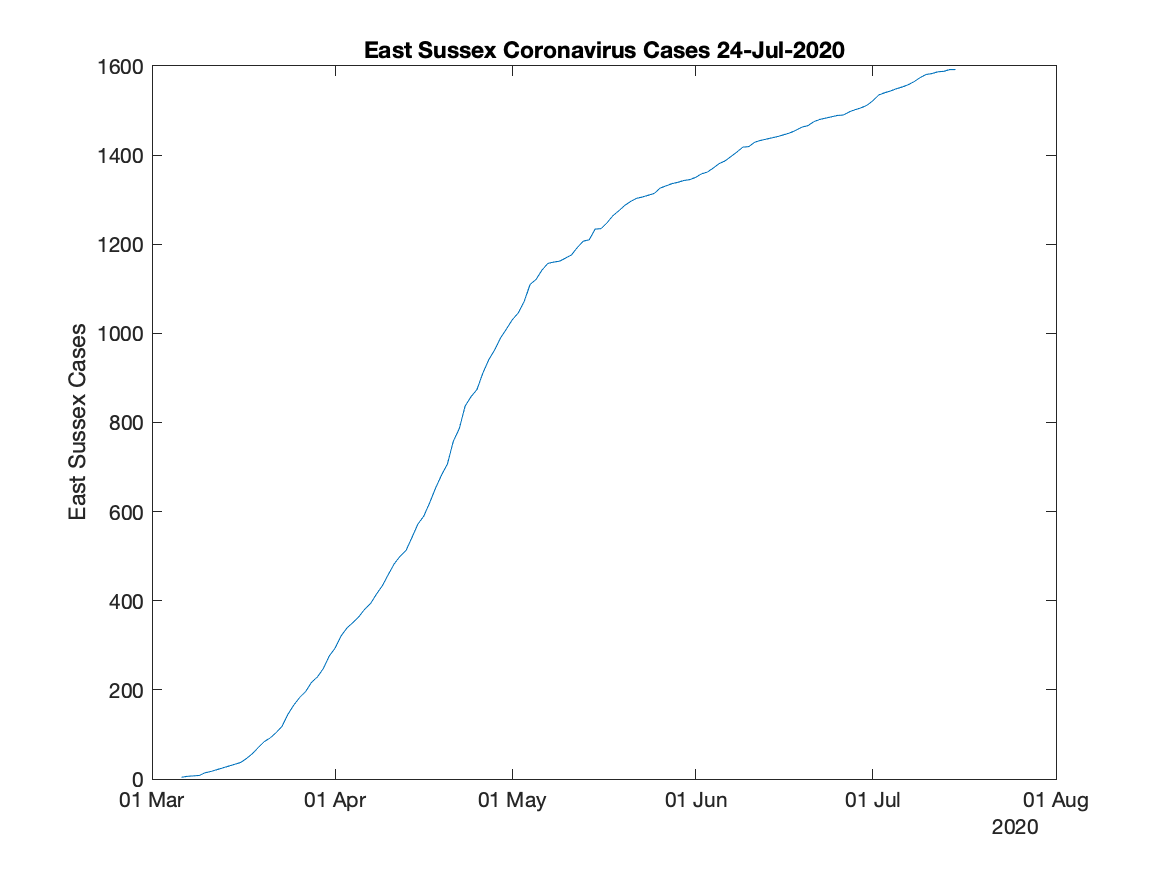
The MATLAB code is here.